|
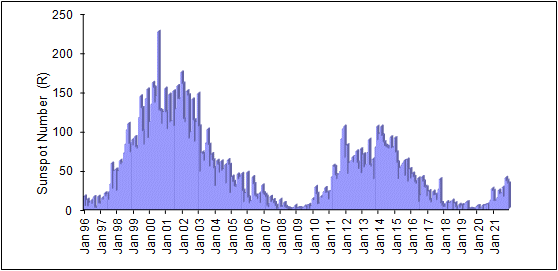
There are various measurements that can be made by the solar observer. The one shown below is the sunspot number R. This is calculated from the number of groups and the number spots seen each day. The average value from the observations made during each month is then calculated - it is these monthly averages that are shown in the plot. This shows that sunspot activity gradually increased from the start of solar cycle 23 in 1996 to a maximum activity period in 2000 to 2002 and then a decrease towards solar minimum.
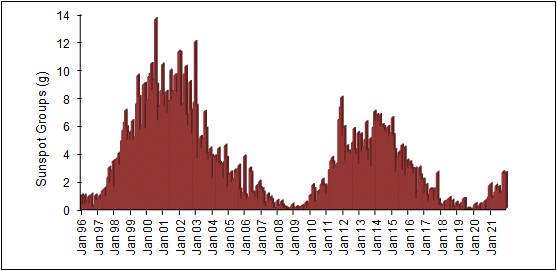
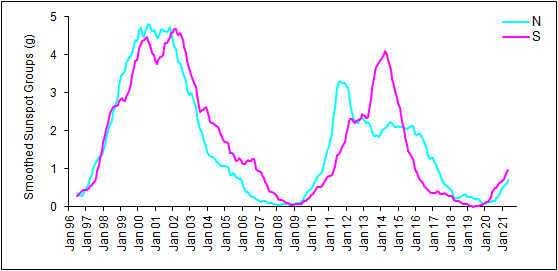
A slightly easier measurement to make than R is the average number of sunspot groups (g) seen each day during the month. The plot below shows similar trends to the sunspot number R. The number of groups can be split into the northern and southern solar hemispheres. The second plot below shows the northern hemisphere g values in turquoise and the southern hemisphere g values in purple. One hemisphere can dominate activity for several months before switching to the other hemisphere.
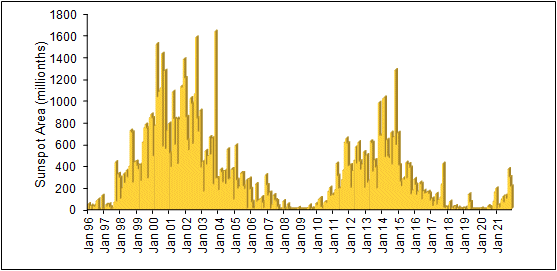
One advantage of making disk drawings is that the area of sunspots can be measured. The units of sunspot area is millionths of the suns visible hemisphere. From each daily observation, the total sunspot area can be measured and a monthly average calculated. This month averaged sunspot area is shown below - a different monthly variation to both R and g can be seen.
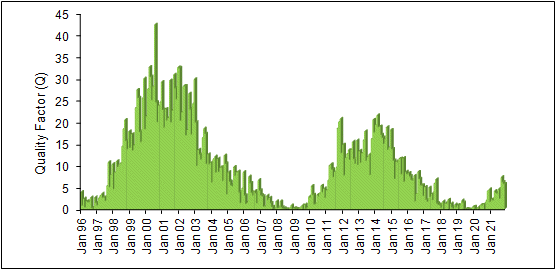
Instead of measuring the number of spots or groups, the class of the sunspot groups visible can be determined. Each sunspot group class is assigned a number from 1 to 6 with the simplest groups, class A, being assigned 1 and the most complex and longest groups, class F being assigned 6. Again the monthly average, Q, can be calculated. This is shown below. Similar trends to R and g can be seen.
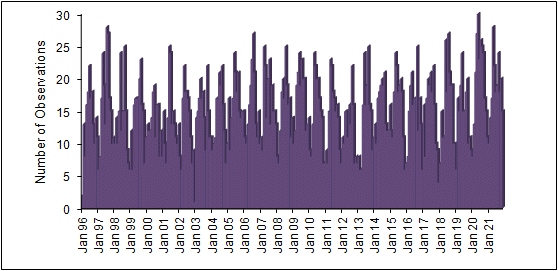
As all the measurements shown above are based on my own observations, it is not possible to observe the Sun every day due to the weather and work commitments. The plot below shows the number of daily observations made per month. A seasonal variation is clearly evident. During recent years almost 200 observations have been made per year.
Last updated on 13 April 2009. |

